From Gujarat’s monsoon to hydrological forecasting
Building the Gujarat Monsoon Monitor, learning from the Saurashtra floods, and forecasting river flow with SeqLSTM-MHA.
By Aravinthakshan · With contributions from Hiren Solanki (Hiren sir), IIT Gandhinagar
A rainfall total is a starting point. To understand a flood, we also need to ask where the rain fell, what happened upstream, how much water a reservoir was already holding, and when the river will respond.
My work with the Water & Climate Lab at IIT Gandhinagar touches two parts of that problem: making Gujarat’s rainfall and reservoir observations easier to explore, and developing models that forecast water level and streamflow one to three days ahead. This post brings together the website, a flood case study by Hiren sir, and our hydrological forecasting paper.
01 — Gujarat, in context
A monsoon can change the picture in two days
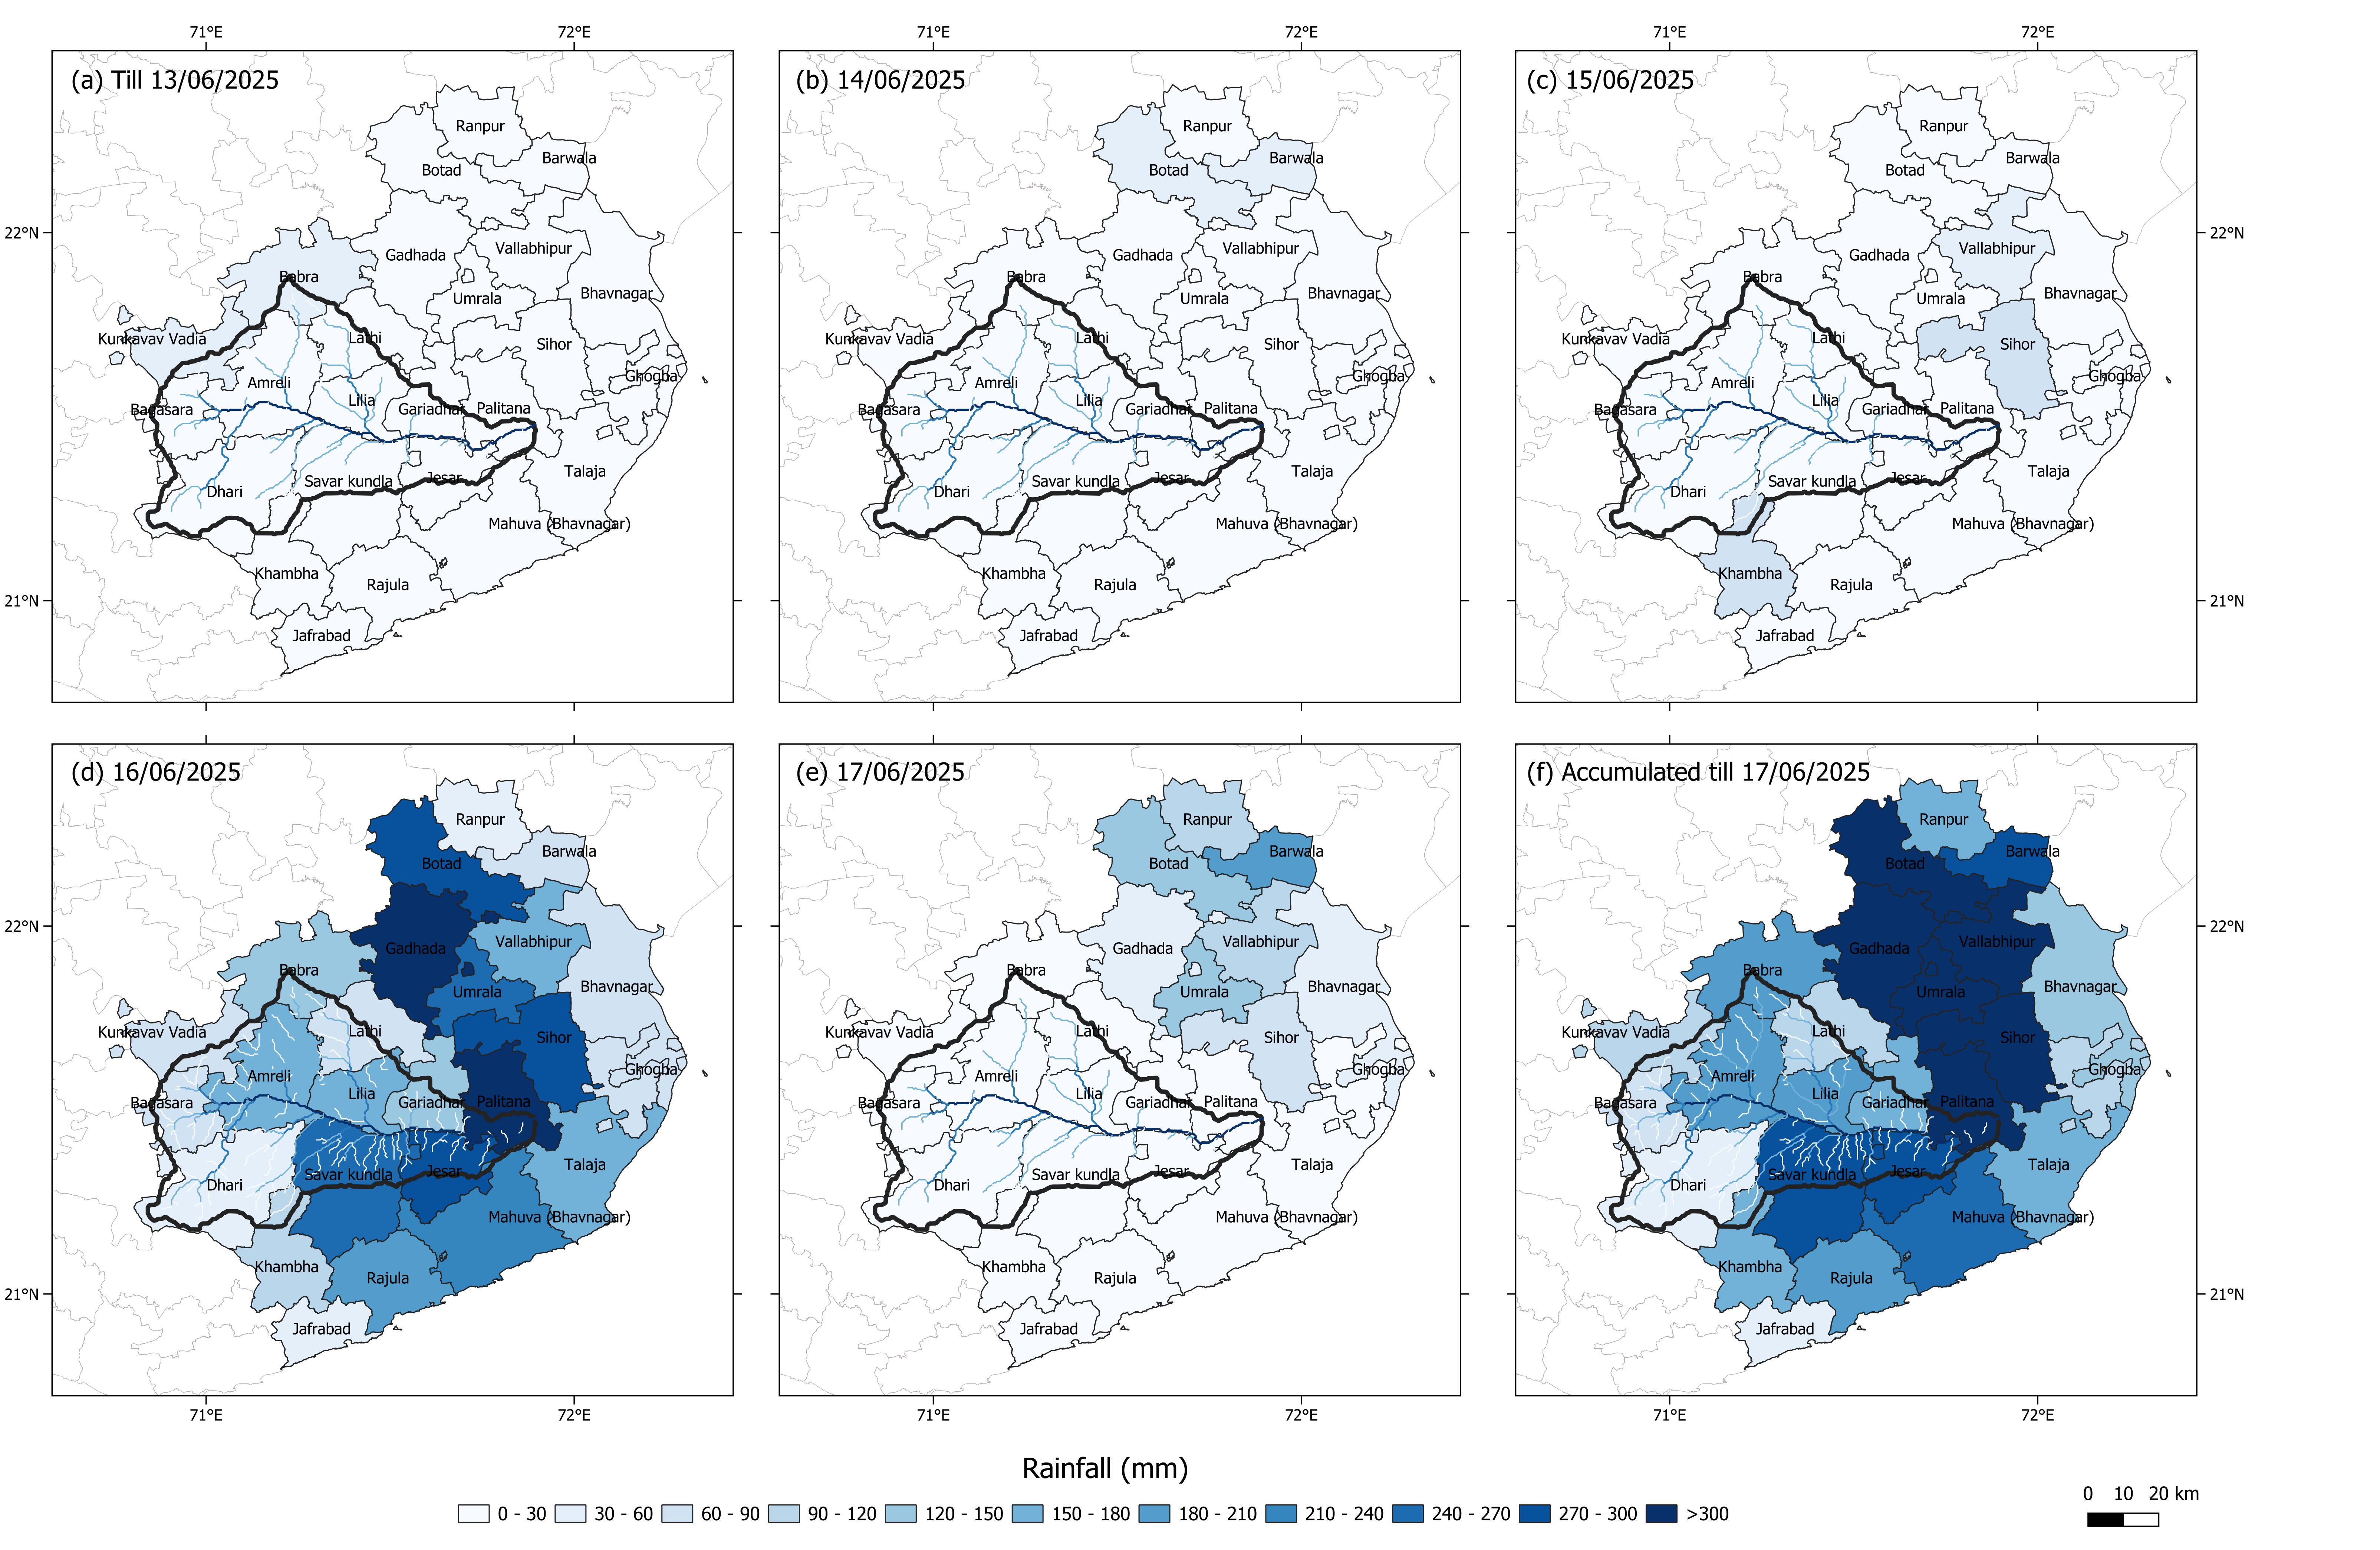
Hiren Solanki’s Saurashtra flood case study documents the intense rainfall of 16–17 June 2025 across Botad, Amreli, and Bhavnagar. It reports 48-hour totals of 358 mm in Sihor, 386 mm in Umrala, 418 mm in Botad, and 387 mm in Gadhada.
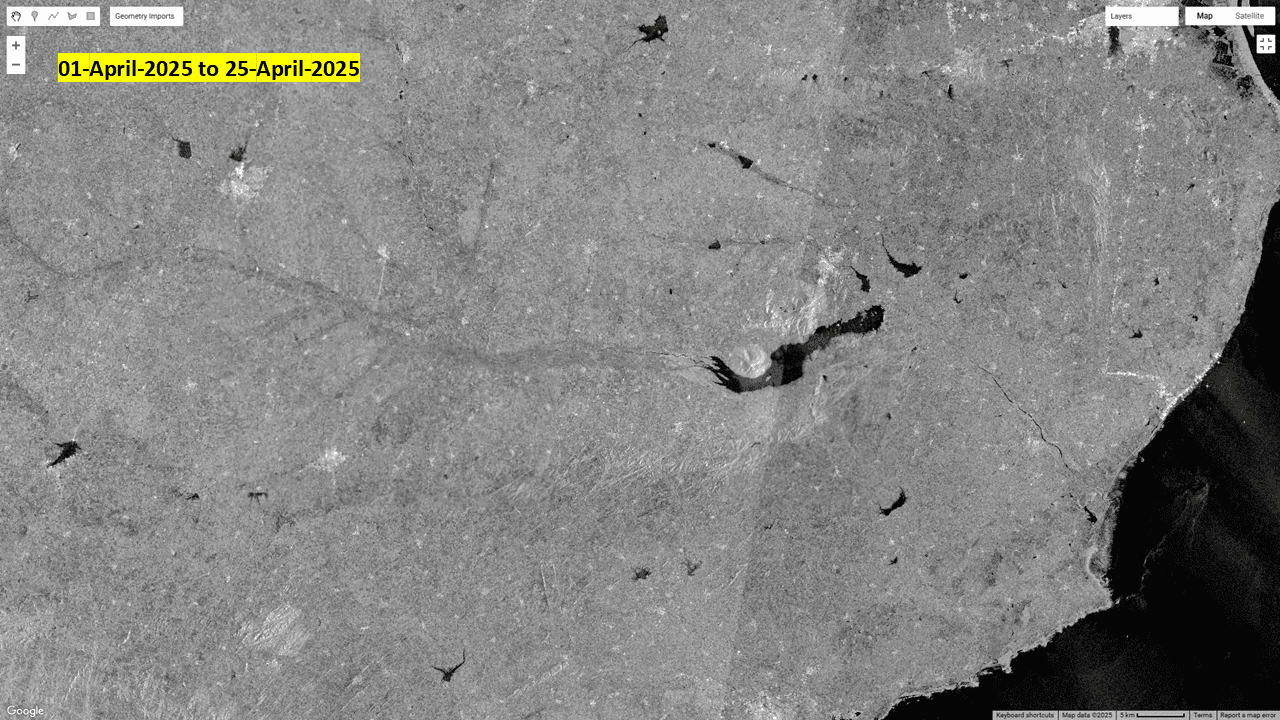
The same account follows Shetrunji Dam as storage approached 94% of capacity by the evening of 17 June. Sentinel-1 radar imagery adds a spatial view of the flooding. Rainfall, reservoir history, and satellite observations each tell a different part of the event; bringing them together makes the sequence easier to understand.
Watch the change around Shetrunji Dam
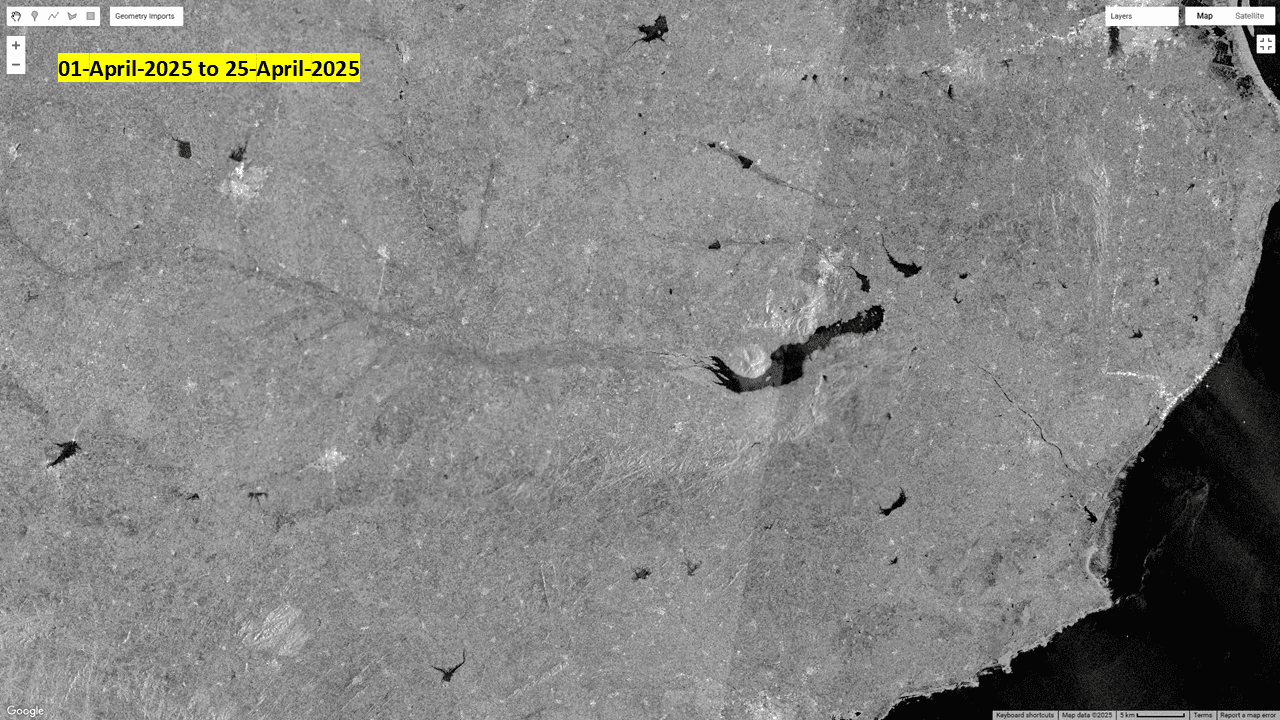
Play Hiren sir’s animation to alternate between the 1–25 April 2025 reference imagery and 17 June 2025. Watch the reservoir near the centre and the river corridor extending towards the coast: the dark water-covered areas change after the heavy rainfall. The comparison gives a spatial view of the event alongside the rainfall totals and reservoir-storage account above; it does not directly measure water depth or discharge.
April 2025 ↔ 17 June 2025 · Shetrunji Dam
02 — Making observations accessible
The Gujarat Monsoon Monitor
The website puts taluka-level rainfall and reservoir storage on interactive maps. You can inspect daily rainfall, season totals, rainfall as a percentage of the annual average, and the history of individual talukas and reservoirs.
Its data comes from official state reports: the State Emergency Operation Centre’s rainfall reports through GSDMA, and dam reports from Gujarat’s Narmada, Water Resources, Water Supply & Kalpsar Department. A Python ingestion pipeline downloads and parses the reports, stores dated records in MongoDB, and makes them available through a Next.js application with Leaflet maps and history charts.
A practical engineering lesson here is that data freshness and data coverage are separate concerns. A scheduled update can run successfully while an older report remains unavailable. The pipeline checks that a report contains a plausible number of records before replacing a day’s data, and retries missing reports. Gaps in the source should never be interpreted as zero rainfall.
03 — Looking one to three days ahead
Sequential forecasting with memory and attention
Our paper, One to Three-Day Lead Streamflow Forecast Using Multi-Head Attention With Long Short-Term Memory in Reservoir Regulated Catchment, was published in Water Resources Research in August 2026. I co-authored it with Hiren Solanki, Sayuj Gupta, and Vimal Mishra.
The study focuses on the reservoir-regulated Narmada basin. Reservoirs complicate the relationship between rainfall and downstream flow: water can be stored and released, changing the timing of the river’s response. This is a separate study area from the Saurashtra event above, but it addresses a related question: how can past observations give us useful warning of what comes next?
Start with the recent history
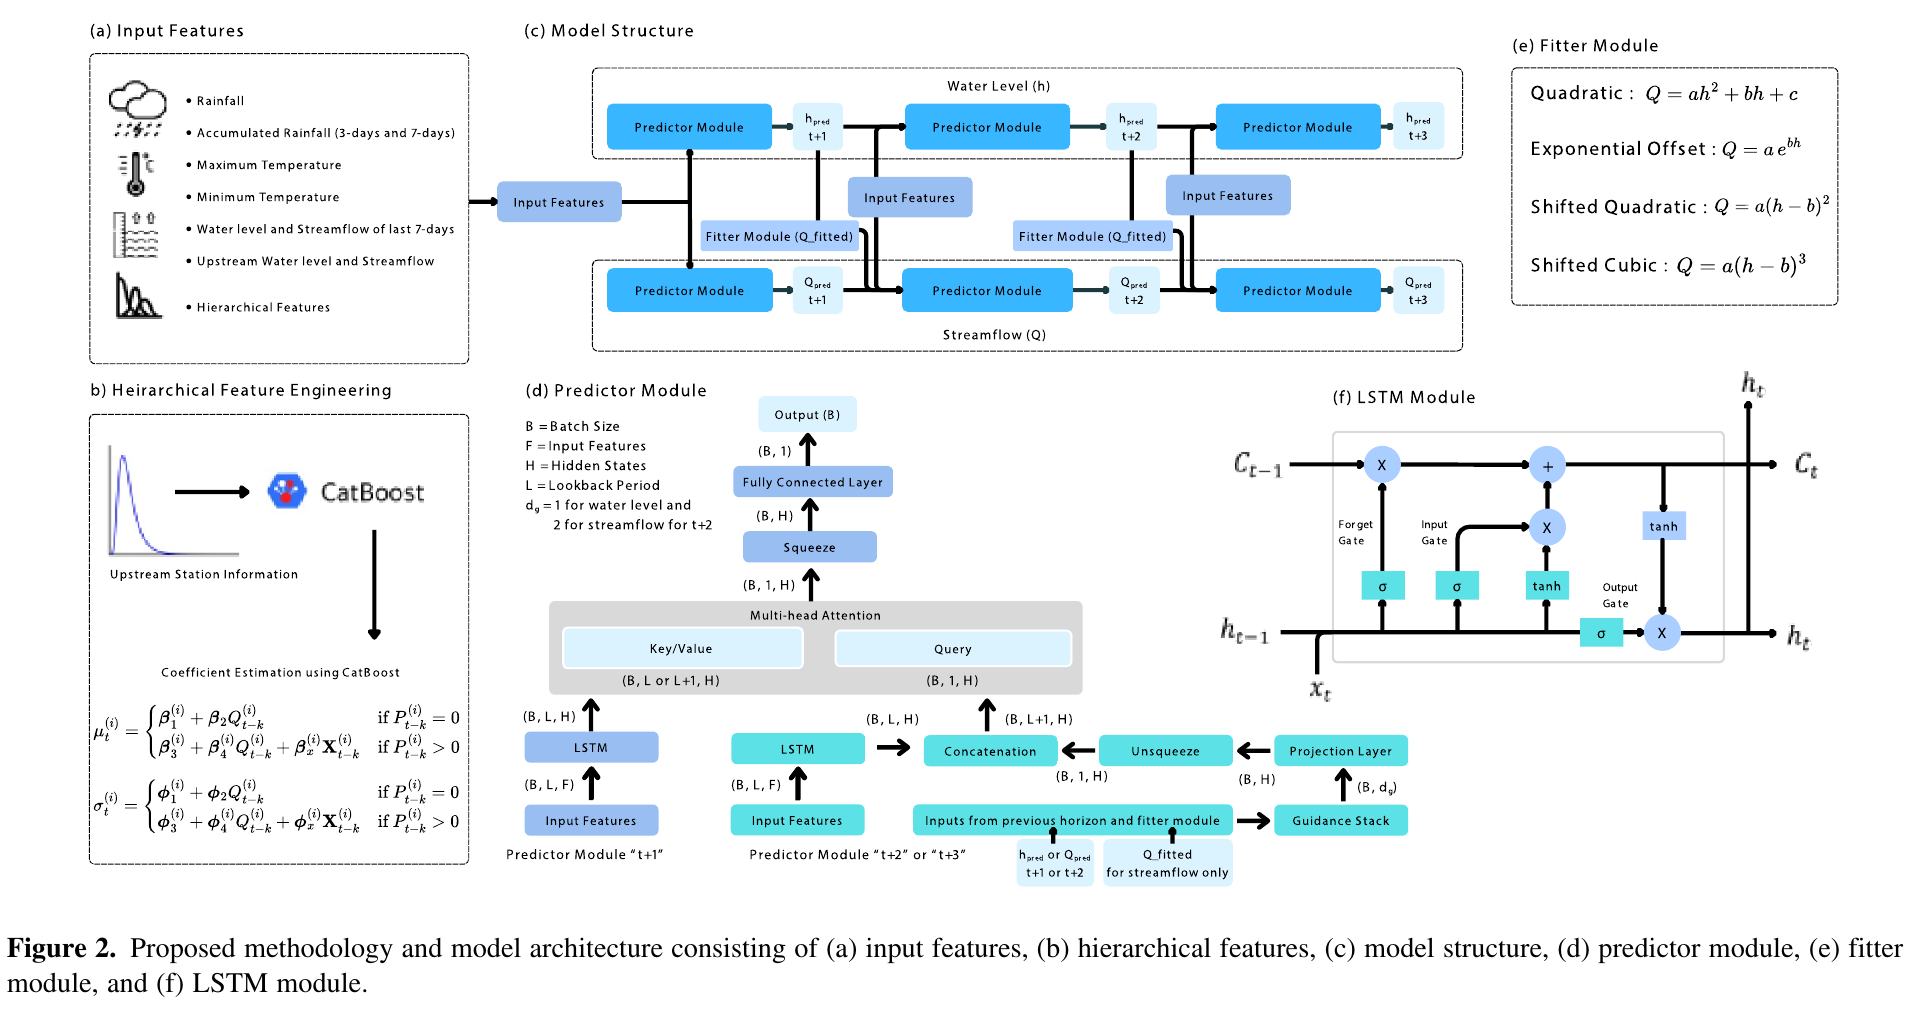
The inputs include rainfall, accumulated rainfall, temperature, and recent water level and streamflow. Upstream observations and hierarchical features add information about conditions elsewhere in the river network.
Encode, then attend
The LSTM encodes the input sequence. Multi-head attention lets the predictor weight encoded temporal information when producing the forecast.
Connect the forecast horizons
Earlier predictions guide the next stage: the one-day forecast informs the two-day forecast, and the two-day forecast informs the three-day forecast. Each stage also receives input features.
Link river height and flow
The fitter module maps water level to streamflow through fitted rating curves. That estimate provides additional guidance to the later streamflow predictors.
The architecture makes the relationship between inputs and lead times explicit. In the research repository, configuration switches separate sequential prediction, attention, hierarchical features, and the fitter so their contributions can be compared.
04 — Reading the evidence
What the published results show
Table 1 compares SeqLSTM-MHA with multiple linear regression, vanilla LSTM, CatBoost, and bidirectional LSTM for the 2011–2019 evaluation period. The metric is Nash–Sutcliffe efficiency (NSE): 1 indicates a perfect match, while 0 corresponds to predicting the observed mean.
SeqLSTM-MHA records streamflow NSE values of 0.74, 0.73, and 0.71 at one-, two-, and three-day leads. For water level, the corresponding values are 0.85, 0.85, and 0.81. The comparison is useful because it shows how performance changes as the forecast moves further into the future.
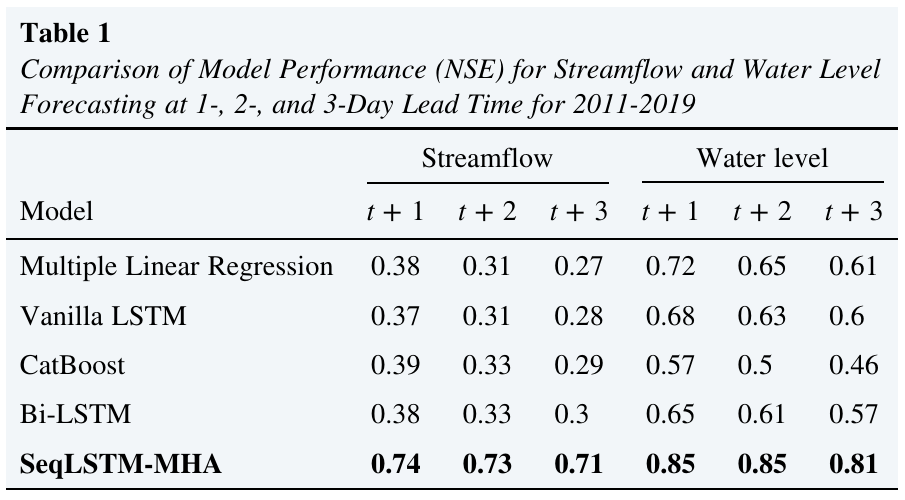
These are retrospective evaluation results. Their value is in demonstrating the method under the study’s conditions; deploying a forecast would also require timely inputs, monitoring, and evaluation under changing conditions. A strong aggregate score is a reason to inspect individual flood peaks and their timing, not a substitute for doing so.
For me, the connection between the two projects is practical. The monitor makes observations inspectable. The research asks how those kinds of observations can support useful lead time. Both depend on careful treatment of where the data came from and what it can tell us.
Contributors & further reading
Hiren Solanki (Hiren sir), PhD Research Scholar at IIT Gandhinagar, is a contributor to the Gujarat Monsoon Monitor, the author of the Saurashtra flood case study, and the first author of our forecasting paper. I want to explicitly acknowledge his contribution to the work discussed here.
The monitor’s team includes Hiren Solanki, Aravinthakshan, and Sayuj Gupta. The paper is co-authored by Hiren Solanki, A. S. Aravinthakshan, Sayuj Gupta, and Vimal Mishra.
Solanki, H., Aravinthakshan, A. S., Gupta, S., & Mishra, V. (2026). One to Three-Day Lead Streamflow Forecast Using Multi-Head Attention With Long Short-Term Memory in Reservoir Regulated Catchment. Water Resources Research, 62(8), e2025WR042482. doi:10.1029/2025WR042482.